My broker's app is good at two things. It shows what I own. It shows whether that went up or down today. That's just basic portfolio data.
I wanted to know how my money was really doing, read from my own trades. Is the company I bought still has good fundamentals? Am I over-exposed to certain stocks? How's the demand for gold? What are the current macro-economic conditions? And I wanted help deciding what to do next, at the moments when a decision is due.
I have tried some popular tools from the market but was not satisfied with their analysis. Mainly due to the lack of clarity on what they are saying, terrible user experience, ads, and most importantly, the fact that I would not like to share my trading data to another company.
So, with the help of claude code, I built a tool for myself, called money overflow. This is the story of the product, what it shows and how it is laid out, and of the engineering that makes its numbers safe to trust.
Its mark is an ashok tree. A tree grows slowly and branches as it grows, and a portfolio should do both. Under the name sits a 2500 years old line from Chanakya, धर्मस्य मूलमर्थः. It says that artha, (material prosperity through righteous means), is the root of dharma, (righteousness, moral values, etc.). While dharma is always above artha, in Kaliyug, artha is quite important to perform one's dharma.
- 12 weeksfrom the first commit to version 1.0
- 450commits
- 4,024automated tests on the Python core
- 579automated tests on the web pages
- 176Python modules in the core
- 788plain-English glossary entries
- 29,733source downloads, each stored before it was read
- 19pages in the menu, and one for every company
Two questions, not one
The first question sounds simple. How is my portfolio doing?
A broker answers it with a total and a percentage. That number hides most of what I care about. It cannot tell me whether my own share picking beat a plain index fund. It cannot tell me whether seventeen holdings are seventeen bets, or three bets under different names. And it says nothing useful about gold and silver, which are a large and deliberate part of what I hold.
The second question is harder. What should I do now?
The honest answer depends on the date. In March, before the tax year closes, it is a tax question. After a salary lands, it is a question about where the new money should go. After gold falls sharply, it is a question about how often a fall like this has recovered before.
The tool had to answer both questions in words I could follow without a finance degree.
How the site is laid out
money overflow is a website. My own copy sits behind a sign-in. A public demo runs the trimmed version of same code on an invented investor's money.
Its menu has four groups. Each group is a question in the reader's own words, and the pages under it answer that question.

My money says where things stand today. Home gives the value and Veena's brief. Allocation shows the mix against its ranges, Holdings lists each position, and How it grew draws the growth over time. On my own site, a page on pay and spending sits here too, because savings are where new money comes from.
What I did keeps the record. It holds a diary of decisions, every sale with its profit, the tax page, and the full ledger of trades.
What I hold looks at the things themselves. Gold and silver are read against their own long history, and the funds that hold them against the metal. The economy page follows what moves both. Every company I own or follow has a page of its own.
Behind the numbers is why any of it should be believed. It holds a short course on the ideas, Veena's record of calls, where each figure comes from, why each design choice was made, and every past update.

Beside the panels, a margin says what each one is for, how to read it, and what it cannot tell you. Every figure has a plain-English entry a tap away. On a phone, the menu folds into a bar along the bottom.
It starts from the raw files
The tool knows only what I download from my broker. One file is every trade I have made. The other is the list of what I hold today.
The first job is to make those two files agree. Every buy and sell, added up, must equal what the broker says I hold now. If one holding disagrees, the import stops and names it. That single check catches events that never appear as a trade, such as a bonus issue or a share split.

It also caught a quieter problem. One fund I hold changed its ticker partway through. My older trades sat under the old ticker, and today's list knew only the new one. Anything keyed on the ticker would have lost the older history without a word. So the tool keys every holding on its ISIN, the identity code a security carries, and treats the ticker as a label that can change.
The rule everything else serves
That brings us to the one rule the whole design rests on. The AI never computes a number.

Every figure on every page comes from tested Python code. Each figure carries where it came from and how much of the subject it covers. That second part matters more than it sounds. A number can be computed correctly and still describe only a small slice of what it seems to describe, so the page says so beside it. When a figure cannot be worked out, the page says it is missing. It never shows a guess.
The AI writes the prose. Inside the app the writer is called Veena, and every note says she is an AI. She reads the figures and says what they mean together. She may quote a number only if a figure beside her note spells it.
Her notes are checked before they reach the page. Three fresh readers get only her words and say what they took from them. Three separate graders check that no sentence claims more than its figures count. If most of them misread a note, or find it claiming too much, it does not render.
How is it doing, said plainly
So what does the tool say that a broker does not? Here are three things. The numbers come from the public demo, a trimmed copy that runs on an invented investor's money.
How spread out the money really is. The demo's investor holds 17 things. The page says the money is spread as if across about 13 equal holdings. A few large positions carry more than their share, and the second number shows it.

Whether picking shares was worth it. The tool replays the same purchases on the same days, with the money spent on shares going into a plain index fund instead. On the demo, the investor's own picks made 16.26%. The same money in the funds made 17.97%. That gap is the most useful finding on the page. A broker has no reason to show it to you.

A range, not a target. I hold far more gold and silver than conventional advice suggests, on purpose, as protection. A tool that flagged that as a breach every day would soon be ignored. So each part of the portfolio gets a range with three edges: a floor, a warning line and a hard limit.

Inside the range, the plan is working and nothing is asked of you. Only crossing the limit asks for action. On the demo, shares are past their limit, and the page says so in words. Gold and silver sit inside their own range.
Companies, read from what they file
Shares in single companies are the other big part of the portfolio. For each one, the tool reads the results the company files with the exchange, every quarter and every year. It then asks what a careful buyer would ask, and answers each question against a named source.
The companies in these pictures are invented, and so is the investor who holds them. Their figures are made up from real exchange filings. Nothing here is a view on any company, or advice.
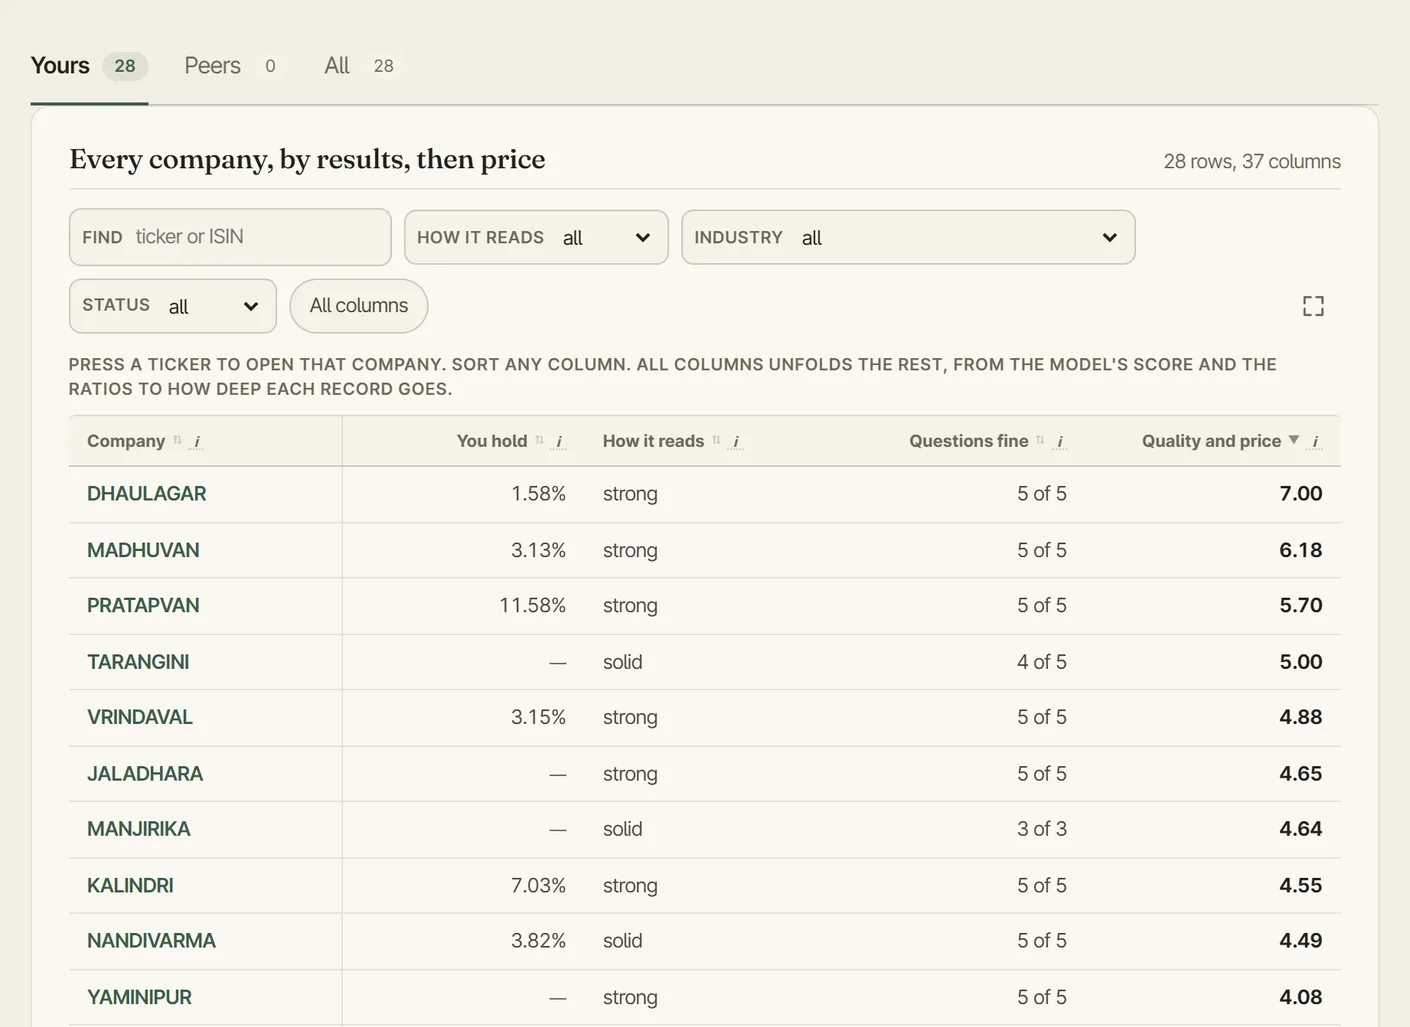
The Companies page puts every company in one table, in order of how it stands. That order adds two things together. One is how well the newest results scored. The other is what the price adds: cheap against the company's own earnings history earns points, and dear loses them. A company with nothing to grade gets no rank at all rather than a low one, so an empty cell is never mistaken for a bad result.
Open a company and five plain questions come first. Is it making money, is it growing, can it pay its debts, is anything worrying, and is the price reasonable?

Each answer is a word, one sentence, and the figures behind it. This company kept 5.2% of its sales as profit over the last year. Its sales grew 0.1% a year over three years, slower than prices rise, so the page says to watch it. Its accounts also sit in the grey zone of Altman's score, a published test of how closely a company's accounts resemble those of companies that failed. None of the five says the company will do well. They are checks, not a ranking.
Under the questions sits the company's whole record, one line per measure for every quarter on file.

Profit is read with one-offs set apart, such as the sale of part of a business, so one unusual quarter does not pass for a trend. Gaps stay gaps. The oldest quarters have no growth rate, because there is no earlier year to compare them with, and the line is left broken rather than joined across.
The page also lists the days a share moved furthest from the rest of the market, beside what the company told the exchange around each one. And Veena reads every company. When she says how a company reads, she also writes down what its next results should show. A later filing settles it, and a miss counts against her record.
My own site goes further. It draws a price range for each company, six months and a year ahead, labelled by how often ranges like it held in the past. It carries price pages for about 1,500 listed companies, and full pages for 240 peers of the companies I own.
Gold and silver, read from their own history
Gold has no earnings to value it by. So how do you judge its price? The tool reads it against its own long record.
What it costs in today's money. After taking inflation out, gold on the demo's date cost more than in 99 of every 100 months of the last 58 years. That one sentence frames any decision to buy more of it.

How often a fall like this one recovered. On that date, gold was 26% below its January high. It had fallen that far 30 times before. Nine of those times it was back at a new high within a year.

Thirty cases is not many. So the page gives the chance of a recovery within a year as a range, somewhere between 2 and 6 in 10. It never offers a single confident number. The economy page then follows what usually moves the metals, such as real interest rates, and shows whether each old link still holds.
Help at the moment a decision is due
The second question was what to do now. It turned into a set of answers, each of which appears when it is useful.
When new money arrives, the plan says how much would go into gold and silver and how much into shares to bring the mix back inside its ranges. On the demo it stops at that level and names no share.

Before the tax year closes, a harvesting plan lists sales that lower the tax. Each one sells the oldest units of a holding and buys the same number back the next trading day. Because the units come back, the mix stays the same. The point is to book gains inside the yearly tax-free allowance, and to set losses against gains. A sale stays on the plan only if it saves more than its trading costs.
When a forecast is made, it is scored. Every price range the tool draws for a company is first tested against its own past record. A call Veena makes is written down with a date, and the code settles it later. Her record of hits and misses sits on the page beside her.
Why I trust the numbers
A tool that explains numbers is only as good as the numbers it explains. So most of the engineering went into the part nobody sees: keeping the data clean.
Every source is kept before it is read. Each time the tool fetches a price, a fund's value or a company's filing, it saves the raw response first. That copy is hashed and committed before any code interprets it. Scrapers rarely break with an error. They break by quietly reading the wrong cell, and the stored copy is how that gets caught. The record now runs to 29,733 fetches.
Only one module may touch the network. Everything else works from those stored copies. A test reads the source of every other module, and the build fails if one of them could open a connection. Without that rule, the day a stored copy is inconvenient is the day someone reaches for the live page.
A row is trusted for what it holds, not where it sits. The official daily file of mutual fund values looks like a list of today's prices. It carries 827 different dates, some of them from 2015. So every row keeps its own date. A code is accepted as an identity only if it has the shape of one, whatever its column is called.
Holdings are valued at the exchange's own closing price. The broker's export lists a price too. That price is from whichever day the file happened to be downloaded. The tool uses the export only to check quantities and what they cost, and values each holding at the newest close on record. Where a holding has no close, the page says which price it used instead.
The web page cannot do arithmetic. Every value reaches the page already formatted by the Python that computed it. The page's code is typed so that adding two values will not even compile. No number on screen comes from code that no test has seen.
Nothing private leaves my machine. Account numbers and broker codes are never committed, at any level of sharing. Before the demo is uploaded, a gate scans every byte of it against 646 real security codes, 296 tickers and 847 registered names. One match stops the upload.
A bad page fails the build. Every number on screen needs a plain-English glossary entry, and there are 788 of them. No sentence may run past 25 words. In all, 4,024 tests guard the Python and 579 guard the web pages. The whole Python suite runs before every commit.
What it is built with
The core is plain Python, with one library for typed data and one for reading an old spreadsheet format. Every figure it produces is a typed record that carries its value, its source and how much of the subject it covers. The website is React and TypeScript, built with Vite, and it draws its own charts. Both copies are served from Cloudflare, and mine sits behind a sign-in. Veena's notes are written by Claude, Anthropic's model, and the readers and graders that check them are Claude models too.
What building it taught us
The biggest lesson was about gates. Writing "explain every number" in a plan achieved nothing. A test that fails the build when a number has no plain explanation achieved what the plan could not. We did the same for sentence length, and for words a layman would not know. We did it again for any sentence that tells a reader what to do.
The second lesson was that a writer cannot proofread their own clarity. A sentence that read perfectly to us was often misread by a fresh reader. That is why every note here is read by someone who did not write it.
Seeing it
The demo runs the same code on an invented investor's money. It is a trimmed copy, though, and calling it the whole tool would undersell what the full application does.
Measured by the figures it works out, the demo carries about four fifths of the full application. Measured by what Veena writes, it carries 2 of the 12 notes a round produces. It has none of the market price pages or peer companies, no pay and spending page, no shortlist of shares to buy, and no headlines from what companies told the exchange.
Its prices are a month old, and its companies go by invented names. Nothing on it is advice to you.
The code stays private, because it holds every trade I have made.
Written by Brijesh Chandrakar with Claude (Anthropic) as co-author. Nothing here is investment advice.